 Follow Nordpil on Twitter!
Nordpil.com - custom maps and visual communication
- February 13, 2017
- Pappaindex - interactive map of gender equality in Sweden
-
-
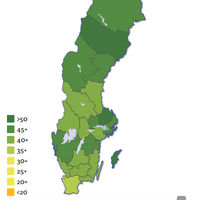
Interactive map to visualize statistics on gender equality and parental leave in Sweden. The client is TCO, one of Sweden's larger trade unions. The map, which allows zooming and inspecting the situation at municipal level and presents annual statistics from 2000-2014, was implemented using the D3 Javascript library, and fully renders charts and maps in the web browser client.
- February 2, 2017
- Water and human livelihood resilience: a regional-to-global outlook
-
-
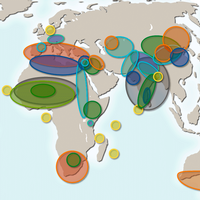
Scientific article, published in the Springer journal International Journal of Water Resources Development. Hugo Ahlenius of Nordpil assisted the author, professor Malin Falkenmark of Stockholm University, by preparing all illustrations for this article. He also prepared the document for submission, including reference management and formatting. The article reviews the current and future state of freshwater roles, needs and uses.
- January 24, 2017
- Arctic Resilience Report 2016
-
-
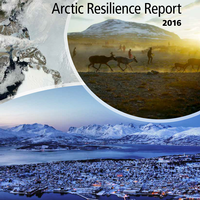
This multidisciplinary study is a comprehensive assessment of Arctic change and resilience, including factors that appear to support or weaken resilience. It provides an overview of tools and strategies that can be used to assess and build resilience in the Arctic, and considers how the Arctic Council can contribute to these efforts. Hugo Ahlenius of Nordpil prepared all illustrations for the report, in close collaboration with the editorial team and contributing scientists.

Nordpil, founded in 2008, is a Swedish-registered geographic services consultancy specializing in custom map design, including cartography, geographic information systems (GIS) and the visual communication of scientific information and data through illustrations, charts and diagrams.

It is a constant challenge to explain complex scientific and environmental issues, especially when illustrating relationships of space and time. Creating graphics that break through the noise and communicate the issues easily to viewers is difficult, even though our tools are very powerful. At Nordpil, we specialize in providing clear, powerful and attractive maps, charts and other graphics for print and the web. To help communicators, scientists and analysts improve their visual communication skills, we offer education and training packages.

We have prepared geographic data and visual material that has been published in National Geographic, Nature and major newspapers. Reports from the UN Environment Programme (UNEP), World Resources Institute (WRI), the Stockholm International Water Institute (SIWI) and others have featured graphics prepared by Hugo Ahlenius, who also acted as graphics editor on some of these flagship reports. See the portfolio pages for examples. The illustrations address themes such as climate change, sustainable development, economics, poverty, the environment and many more.
Please contact Nordpil for more information, or use the form to request a quote on how your map, data and communication problems can be solved, with either freelance cartography and map design or training services.
