 Follow Nordpil on Twitter!
Animated maps 1970-2050 for science centre

 As part of an
upcoming exhibition, Nordpil worked with the Heureka Science Centre in Finland,
preparing maps on the economy, population and biodiversity dating back to 1970 and with
projected data to 2050. The animation will be shown on large displays at the centre in autumn
2011.
As part of an
upcoming exhibition, Nordpil worked with the Heureka Science Centre in Finland,
preparing maps on the economy, population and biodiversity dating back to 1970 and with
projected data to 2050. The animation will be shown on large displays at the centre in autumn
2011.
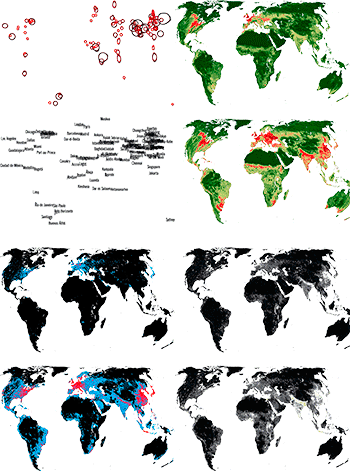
The exhibition focuses on the development of human society to the year 2050. The indicators used in the animation are GDP for economy, GLOBIO3 species analysis for biodiversity, and population density for demographics. In addition, the historic and projected growth of urban areas is included.
To prepare the maps for the animation, Nordpil carried out research using existing data. The data had to be integrated and harmonized for visual impact, and in some places recalculated and estimated.
The maps covered the period from 1970 to 2050, in five-year ranges.