 Follow Nordpil on Twitter!
Maps by Nordpil at ICA
Two maps by Nordpil were selected to represent Swedish cartography at the 26th International Cartographic Conference in Dresden, Germany, August 2013 - organized by the International Cartographic Association (ICA).
The map posters were originally prepared for the 2012 Kartdagarna map exhibition and selected by representatives from the Swedish Cartographic Association.
The map exhibition presents highlighted examples from all over the world, and the selected maps are also included in an exhibition catalogue.
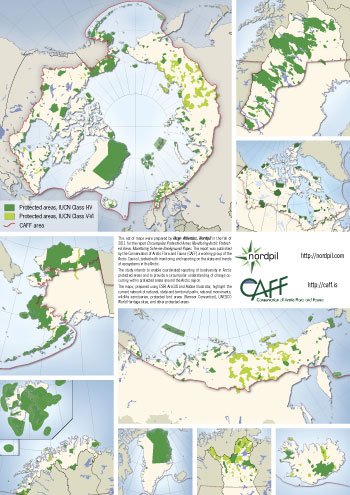 This set of maps was prepared by Hugo Ahlenius, Nordpil in autumn of 2011 for
the report Circumpolar
protected areas monitoring: Arctic protected areas monitoring scheme background paper.
The paper was published by the Conservation of Arctic Flora and Fauna (CAFF), a working group of
the Arctic Council, which is tasked with monitoring and reporting on the state and trends of
ecosystems in the Arctic.
This set of maps was prepared by Hugo Ahlenius, Nordpil in autumn of 2011 for
the report Circumpolar
protected areas monitoring: Arctic protected areas monitoring scheme background paper.
The paper was published by the Conservation of Arctic Flora and Fauna (CAFF), a working group of
the Arctic Council, which is tasked with monitoring and reporting on the state and trends of
ecosystems in the Arctic.
The study is intended to enable coordinated reporting of biodiversity in Arctic protected areas and to provide a circumpolar understanding of change occurring within protected areas around the Arctic region.
The maps, prepared using ESRI ArcGIS and Adobe Illustrator, highlight the current network of national, state and territorial parks; national monuments; wildlife sanctuaries; protected bird areas (under the Ramsar Convention); UNESCO World Heritage sites; and other protected areas.
One of these maps is presented in the Nordpil portfolio.
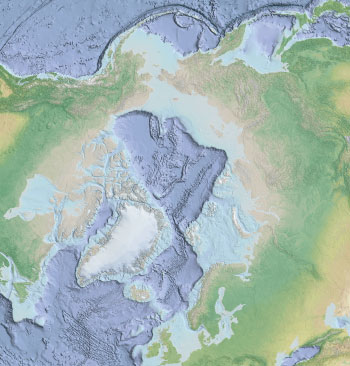 Map prepared by Hugo Ahlenius, Nordpil, as background image for web map
application for marine and oceanographic sciences.
Map prepared by Hugo Ahlenius, Nordpil, as background image for web map
application for marine and oceanographic sciences.
The bathymetry was composited with the highest resolution data available, making this one of the best-resolution Arctic Ocean maps ever created.
The map uses a Lambert Azimuthal Equal Area projection, centered on the North Pole.
Global Mapper, ESRI ArcGIS and Adobe Illustrator were used to prepare the map. The resulting map was merged and rendered from various datasources.
Source data for the map were CleanTopo2, GEBCO, IBCAO and Natural Earth (cross-blended hypsography for land areas). Relief shading was created using Adobe Photoshop.
The colors were enhanced for this poster.
A basemap is used as a backdrop to provide reference and context for thematic data and information overlaid in the map presentation. A carefully designed backdrop should use muted colors to avoid distracting the viewer from the main messages conveyed, while still providing the geographic framework.
This basemap was prepared primarily for Arctic marine and oceanographic needs. The client's primary requierements were that bathymetry and characteristics of the seas be presented. The map was prepared for the entire Arctic region including surrounding areas, and at very high resolution using the best available datasources. The resulting map was rendered as tiles in an image pyramid, deployed using ESRI ArcGIS Server and shared as an OGC Web Map Service (WMS) for consumption in an external application.