 Follow Nordpil on Twitter!
World database of large urban areas, 1950-2050


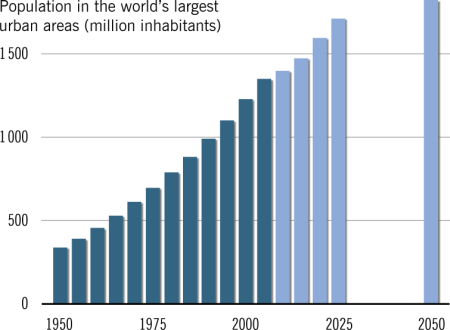
We are happy to share data that we prepared for a project earlier in 2009. Using the data request service provided by the UN Population Division, we have assembled and georeferenced the data from the World Urbanization Prospects, 2007 revision. This database represents the historic, current and future estimates and projections with number of inhabitants for the world's largest urban areas from 1950-2050. The data covers cities and other urban areas with more than 750,000 people.
Data was retrieved from World Urbanization Prospects: The 2007 Revision Population Database (online database), accessed June 8, 2009. The population data was related to the ESRI Data & Maps 2008 cities dataset, where names matched, and coordinates for matching cities were retrieved using Hawhts' Tools. Cities not matched were researched using Google Earth and Wikipedia on June 9, 2009. Most coordinates were retrieved from the coordinate pages on the latter source (toolserver/geohack). The data was rendered as an event layer in ArcGIS, and then exported as a shape file. The exercise was performed using Microsoft Access and Excel, in combination with ArcGIS and Google Earth Pro.
The database is available for unrestricted download, under the Creative Commons 0 License (public domain). This entitles you to reuse and modify the data, without any restrictions. We appreciate if you credit Nordpil and the UN Population Division.
To the extent possible under law, Nordpil has waived all copyright and related or neighboring rights to World database of large urban areas, 1950-2050. This work is published from Sweden.
Releases and versions
- version 1.0, December 29, 2009
- version 1.1 March 1, 2010
Location of certain urban areas were revised with input from Steve Xu, University of Waterloo (thanks!)
License change
Population figures rounded
Downloads
The database is made available in various formats for use in GIS software (such as ArcGIS, uDig, MapInfo, QGis, Global Mapper and Manifold) and in spreadsheet/table format for use in Microsoft Access, Microsoft Excel or other similar software.
- Shape file, for use in GIS software (zip, 100 KB)
- Table/spreadsheet (tab-separated text file, tsv, 100 KB)
- Table/spreadsheet (HTML - best for Excel, 200 KB)
- Google Earth presentation, including timeline and bar charts for individual cities (kmz, 2 MB)
- The data is also available from other sources, but Nordpil does not guarantee the full integrity of those distributions. For references and credit, please refer to this page and consider the downloads available here the primary ones.
Presentations
- A detailed map of large urban areas in 2005 is available on the portfolio page. This map, prepared in Wagner VII projection, presents the cities as circles in five classes.
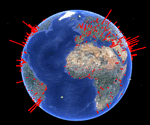 A presentation has been prepared in
Google Earth, with bars for the cities, and a timeline from 1950 to 2050.
See the link above, under downloads to retrieve it for Google
Earth.
A presentation has been prepared in
Google Earth, with bars for the cities, and a timeline from 1950 to 2050.
See the link above, under downloads to retrieve it for Google
Earth.- Maps of the years 1950-2050 were animated by Nordpil and published to Vimeo. This short video clip shows the development and projections in population of urban areas.
Comments and feedback
We appreciate your comments and are aware that the data can be improved. Please use the feedback form to contact us.
Based on work at UN Population Division, http://esa.un.org/.