Map design

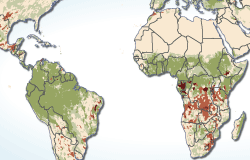
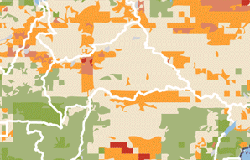
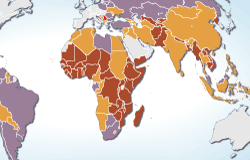
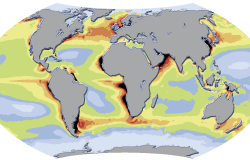
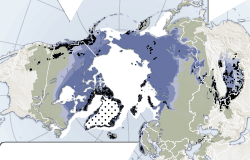
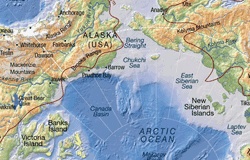
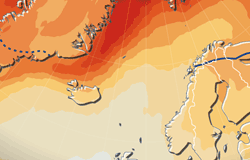
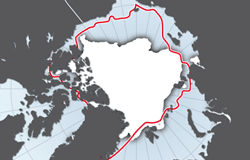
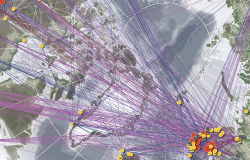
Nordpil loves maps, and we love to make great maps: cartographic products that are clear, legible and beautiful. We are experts in transforming geographic data into stunning visual pieces for print and web.
Do you need amazing illustrations? We look forward to help you out, and solve your needs.
We have more than 10 years of experience in working as graphics editors for reports and in preparing maps for clients such as UN, OECD, Arctic Council and many others. Our illustrations have been featured in major newspapers and are used around the World daily.
Our maps have that little extra attractive design that gets them picked up by bloggers, catches attention in press releases and creates demand for use and reuse.
Do you have data and statistics that needs to be presented in a clear informative way? We have great experience in working with Geographic Information Systems (GIS) and database tools, and how to use these to refine and prepare data for information products.
Please describe your needs in the form below, and we will get back to you shortly. Thanks!
 Follow Nordpil on Twitter!