 Follow Nordpil on Twitter!
Climate change maps for Globalis

 Globalis, a map-based educational website by the Nordic UN associations, was
recently updated with a new portal on climate change. Hugo Ahlenius of Nordpil acquired recent
climate data for the site, adapted it and prepared map presentations using MapBox and TileMill
for the interactive map on the website.
Globalis, a map-based educational website by the Nordic UN associations, was
recently updated with a new portal on climate change. Hugo Ahlenius of Nordpil acquired recent
climate data for the site, adapted it and prepared map presentations using MapBox and TileMill
for the interactive map on the website.
Client: the Norwegian UN Association, FN-Sambandet.
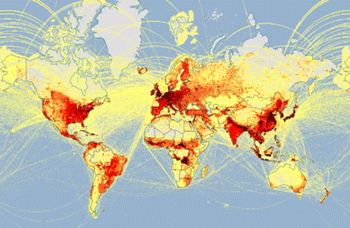
Data added to the map services was primarily based on the recently published Intergovernmental Panel on Climate Change (IPCC) Fifth Assessment Report, and included:
- Temperature projections, 2050 and 2090
- Precipitation projections, 2050 and 2090
- Ocean acidification projections, current conditions, 2050 and 2090
- Greenhouse gas emissions, from the EDGAR dataset published by the European Commission Joint Research Centre (JRC)
- Baseline (current conditions) of temperature and precipitation, from the Climate Research Unit (CRU) of the University of East Anglia, UK
The data was acquired, analyzed and examined using GlobalMapper and ESRI ArcGIS, and output maps prepared as large bitmap images. The images were further edited, where needed, in Adobe Photoshop.
The final maps were prepared using TileMill, styled in CartoCSS and uploaded to MapBox for inclusion in the interactive map.
The interactive maps can be viewed on the Globalis website
(also available in the other Nordic languages):
http://globalis.no/Verdenskart