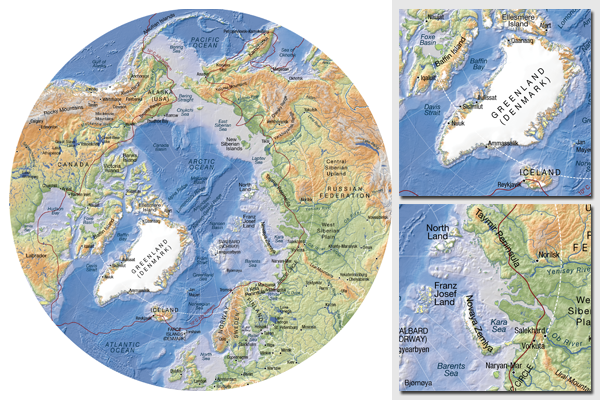
Arctic topographic map, with bathymetry
Illustration prepared for a project within the International Polar Year (IPY) program and featured as the main piece of an educational poster providing an overview of the polar regions, together with a companion Antarctic map.
The map was prepared using data from multiple scientific sources. The data were then modified, classified and projected. The hypsographic tints and shaded relief were prepared specifically for this map, using the CleanTopo2 elevation model.
The software used in this map production was primarily ESRI ArcGIS together with Adobe Illustrator and Adobe Photoshop
For more information, downloads and full data sources, please refer to:
- Arctic, topography and bathymetry (topographic map) at UNEP/GRID-Arendal maps and graphics library
- International Polar Year (IPY) educational poster project - overview/background poster
Do you need powerful, clear and good-looking illustrations?
Nordpil specializes in creating the best maps, charts and diagrams for high-profile publications, please contact us and describe your needs, and we will get back to you with a quote.
Would you like to learn how to prepare better maps, charts and diagrams?
In our training workshops you will learn about the theory about creating powerful visual material based on scientific data and statistics, and we discuss and deconstruct examples from recent publications, news and your work. Read more on our workshop pages.
 Follow Nordpil on Twitter!
