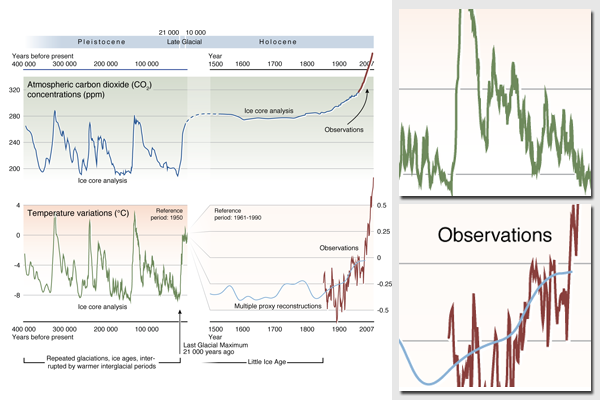
Carbon dioxide and temperature - historic trends on climate change
Layout with multiple charts and explanatory text prepared for the UN Environment Programme (UNEP) report Global Outlook for Ice and Snow, published in 2007. The charts were used as a fundamental background and overview piece, and were featured on the back inside cover of the publication.
To assemble the chart, a number of different scientific data sources were assembled and harmonized to match in the layout, with the same scales and level of detail.
To prepare this map, the data was prepared in Microsoft Excel, Golden Software Grapher, and finally in Adobe Illustrator.
For more information, downloads and full data sources, please refer to:
- Historical trends in carbon dioxide concentrations and temperature, on a geological and recent time scale at UNEP/GRID-Arendal maps and graphics library
- Global Outlook for Ice and Snow
Do you need powerful, clear and good-looking illustrations?
Nordpil specializes in creating the best maps, charts and diagrams for high-profile publications, please contact us and describe your needs, and we will get back to you with a quote.
Would you like to learn how to prepare better maps, charts and diagrams?
In our training workshops you will learn about the theory about creating powerful visual material based on scientific data and statistics, and we discuss and deconstruct examples from recent publications, news and your work. Read more on our workshop pages.
 Follow Nordpil on Twitter!
