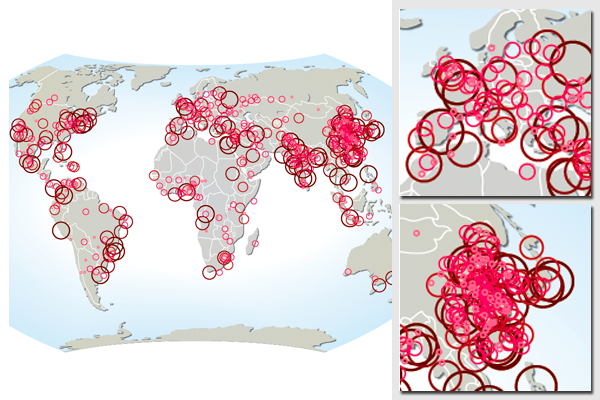
World map of large urban areas in 2005
The population in the urban areas of the world is increasing, and has been increasing throughout history. The cities sprawl out and take more land and resources into account, and later turn into mega cities. This map presents the status for urban areas in 2005, according to the data and estimates from the United Nations Population Division.
Map illustration to demonstrate the United Nations Population Division database, showing quantitative representation of point data through classified and colored circles.
The map is using the Wagner VII projection, with 10E as the central meridian.
ESRI ArcGIS, Global Mapper and Adobe Illustrator were used to prepare the map. The base map data was prepared from the Natural Earth Vector 1:110m distribution.
For more information, please refer to:
- Download and information about the database, under the resources section of this website.
- Raw data downloads, from World Urbanization Prospects, 2011 revision (United Nations Population Division).
- Natural Earth data downloads.
Do you need powerful, clear and good-looking illustrations?
Nordpil specializes in creating the best maps, charts and diagrams for high-profile publications, please contact us and describe your needs, and we will get back to you with a quote.
Would you like to learn how to prepare better maps, charts and diagrams?
In our training workshops you will learn about the theory about creating powerful visual material based on scientific data and statistics, and we discuss and deconstruct examples from recent publications, news and your work. Read more on our workshop pages.
 Follow Nordpil on Twitter!
