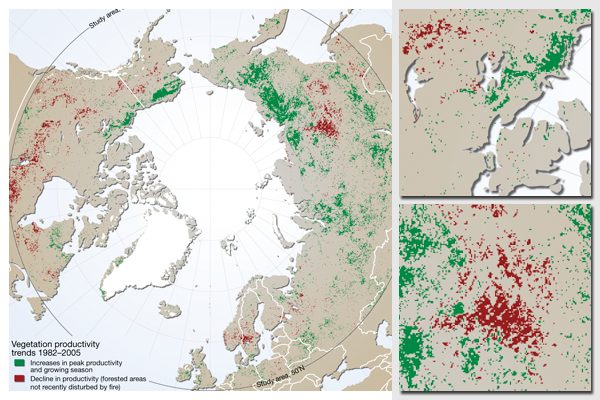
Greening in the Arctic
Comparisons of aerial photographs over time indicate that Arctic vegetation has undergone significant shifts in recent decades and that these shifts might comprise an increasing trend. Satellite monitoring provides a region-wide measure of these changes. The Normalized Difference Vegetation Index (NDVI) is an index of productivity, allowing trends to be examined and related to changes observed on the ground. This index shows that, since the 1980s, changes including increases in shrub cover have occurred. This map presents trends in productivity from a 1982–2005 time series of NDVI data. Significant positive trends, shown as green, indicate an increase in both productivity and growing season. Negative trends, shown as red on the map, represent forested areas not recently disturbed by fire that show a decline in productivity.
Map illustration for the Arctic Biodiversity Trends 2010, an overview report for the Arctic Biodiversity Assessment. This assessment is an activity under the Arctic Council, and is coordinated by the Conservation of Arctic Flora and Fauna (CAFF) program.
The map uses a Lambert Azimuthal Equal Area projection, centered on the North Pole.
ESRI ArcGIS and Adobe Illustrator were used to prepare the map. The base map data was prepared from the Natural Earth database.
For more information, please refer to:
- This map, published on the UNEP/GRID-Arendal website
- Arctic Biodiversity Trends 2010 website
- Conservation of Arctic Flora and Fauna
Do you need powerful, clear and good-looking illustrations?
Nordpil specializes in creating the best maps, charts and diagrams for high-profile publications, please contact us and describe your needs, and we will get back to you with a quote.
Would you like to learn how to prepare better maps, charts and diagrams?
In our training workshops you will learn about the theory about creating powerful visual material based on scientific data and statistics, and we discuss and deconstruct examples from recent publications, news and your work. Read more on our workshop pages.
 Follow Nordpil on Twitter!
