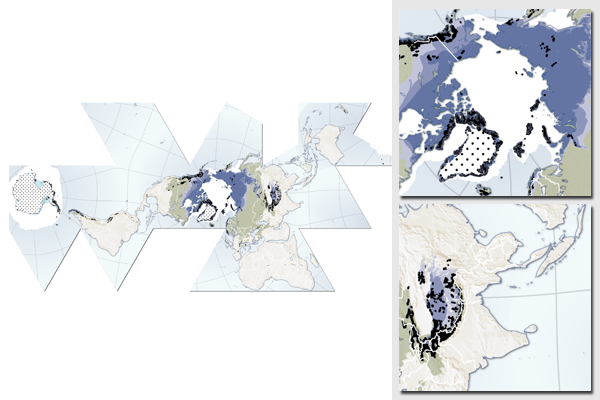
Cryosphere, world map of ice, snow, glaciers, permafrost and ice sheets
World map showing ice, permafrost, snow and glaciers prepared for the UN Environment Programme (UNEP) report Global Outlook for Ice and Snow, published in 2007. The map was used as a fundamental background and overview piece, and was featured on the front inside cover of the publication.
To assemble the chart, a vast number of different scientific data sources were assembled and harmonized to match in the layout, with the same scales and level of detail. The map uses the Fuller/Dymaxion projection to present the whole world without breaking up the North and South poles - the Arctic and Antarctic, respectively.
To prepare this map, the data were prepared in ESRI ArcGIS and further polished in Adobe Illustrator.
For more information, downloads and full data sources, please refer to:
- The Cryosphere, world map at UNEP/GRID-Arendal maps and graphics library
- Global Outlook for Ice and Snow
Do you need powerful, clear and good-looking illustrations?
Nordpil specializes in creating the best maps, charts and diagrams for high-profile publications, please contact us and describe your needs, and we will get back to you with a quote.
Would you like to learn how to prepare better maps, charts and diagrams?
In our training workshops you will learn about the theory about creating powerful visual material based on scientific data and statistics, and we discuss and deconstruct examples from recent publications, news and your work. Read more on our workshop pages.
 Follow Nordpil on Twitter!
