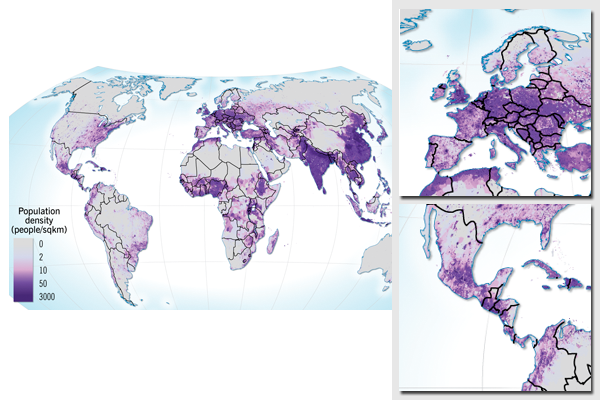
Population density
Population distribution and changes in population are one of the most important driving forces for global change. The number of inhabitants on our planet has rapidly increased in the last 100 years, and continues to rise. Population distribution is highly uneven, and population density is highest primarily in coastal areas in the temperate and tropical zone.
Map prepared as background and discussion material for discussion at the Stockholm International Water Institute (SIWI).
The map uses the Wagner VII projection.
ESRI ArcGIS and Adobe Illustrator were used to prepare the map, in addition to Global Mapper. The base map data was prepared from the Natural Earth database. Population density presented in the map is from the GRUMP database, prepared by CIESIN and partners.
For more information, please refer to:
Do you need powerful, clear and good-looking illustrations?
Nordpil specializes in creating the best maps, charts and diagrams for high-profile publications, please contact us and describe your needs, and we will get back to you with a quote.
Would you like to learn how to prepare better maps, charts and diagrams?
In our training workshops you will learn about the theory about creating powerful visual material based on scientific data and statistics, and we discuss and deconstruct examples from recent publications, news and your work. Read more on our workshop pages.
 Follow Nordpil on Twitter!
