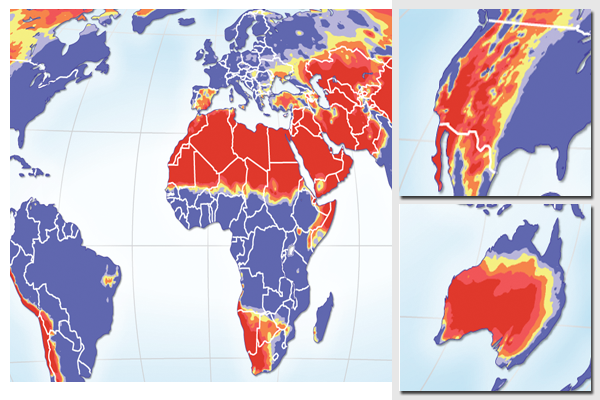
Precipitation in 2050, under scenario SRES A2
Map prepared as discussion material for the Stockholm International Water Institute (SIWI). The map was designed to emphasize areas that are dry and becoming dryer, emphasizing annual precipitation of under 600 mm/year.
The map is presented in the Wagner VII projection.
ESRI ArcGIS and Adobe Illustrator were used to prepare the map, together with Global Mapper. The base map data was prepared from the Natural Earth database. The precipitation data was calculated from CMIP3 with CRU-TS 2.1 as the baseline.
For more information, please refer to:
Do you need powerful, clear and good-looking illustrations?
Nordpil specializes in creating the best maps, charts and diagrams for high-profile publications, please contact us and describe your needs, and we will get back to you with a quote.
Would you like to learn how to prepare better maps, charts and diagrams?
In our training workshops you will learn about the theory about creating powerful visual material based on scientific data and statistics, and we discuss and deconstruct examples from recent publications, news and your work. Read more on our workshop pages.
 Follow Nordpil on Twitter!
