Climate change vulnerability in Sweden
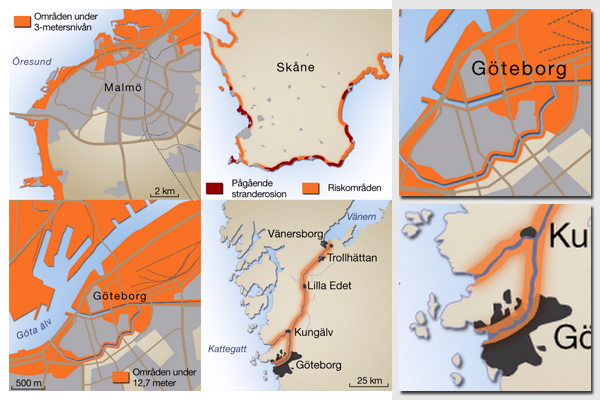
Set of maps prepared for the second issue of the Swedish climate magazine Effekt, published in 2009.
These four maps prepared by Nordpil accompany an article on Sweden's vulnerability to climate change. The illustrations cover such risks as sea-level rise, coastal erosion and mudslides for southern Sweden (Skåne), the city of Malmö and western Sweden (including Gothenburg).
Data and background information were collected from municipal and national sources, with collaboration from the magazine's editorial team.
ESRI ArcGIS and Adobe Illustrator were used to prepare the map.
For more information, please refer to:
- Effekt - klimatmagasinet, 2009/02
- These illustrations are available for licensing and publishing. Please inquire using the contact form for more information.
Do you need powerful, clear and good-looking illustrations?
Nordpil specializes in creating the best maps, charts and diagrams for high-profile publications, please contact us and describe your needs, and we will get back to you with a quote.
Would you like to learn how to prepare better maps, charts and diagrams?
In our training workshops you will learn about the theory about creating powerful visual material based on scientific data and statistics, and we discuss and deconstruct examples from recent publications, news and your work. Read more on our workshop pages.
 Follow Nordpil on Twitter!
