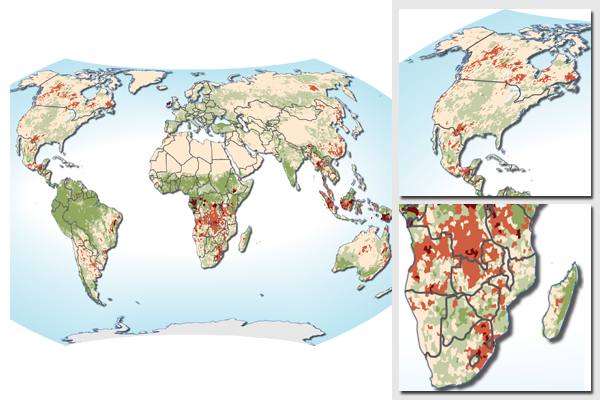
World map of changes in land primary productivity 1981-2003 - land degradation and greening
The unit in the map is Net primary productivity (NPP).
Map prepared for the UN Environment Programme (UNEP) publication The Environmental Food Crisis - the environment's role in averting future food crises, published in 2009.
The illustration was prepared from data received from the team behind an FAO study. Data were analyzed, classified and reprojected to Wagner VII projection - an equal area world projection with low distortion in shape.
Saga GIS, ESRI ArcGIS and Adobe Illustrator were used to prepare the map.
For more information, references, data sources and downloads, please refer to:
- Losses in land productivity due to land degradation at UNEP/GRID-Arendal maps and graphics library
- The Environmental Food Crisis - the environment's role in averting future food crises
Do you need powerful, clear and good-looking illustrations?
Nordpil specializes in creating the best maps, charts and diagrams for high-profile publications, please contact us and describe your needs, and we will get back to you with a quote.
Would you like to learn how to prepare better maps, charts and diagrams?
In our training workshops you will learn about the theory about creating powerful visual material based on scientific data and statistics, and we discuss and deconstruct examples from recent publications, news and your work. Read more on our workshop pages.
 Follow Nordpil on Twitter!
